Loading Tournament...
T20 InternationalONGOING
ICC Men's T20 World Cup 2026
India & Sri Lanka08 Feb – 08 Mar 2026
20 Teams
55 Matches
8 Venues
32 of 55 matches completed58%
Tournament Overview
A quick view of the competition, its progress and leading performances.
Matches Completed
32
Official matches played
Matches Remaining
23
Upcoming group & knockouts
Avg. 1st Innings
169runs
Tournament par total
Highest Total
224/5
Record innings score
Chasing Wins
56%
Second innings win rate
Total Boundaries
1,2864s & 6s
864 Fours • 422 Sixes
Stats Overview & AI Accuracy
Based on 32 completed matches. Accuracy is calculated from published match-stat analyses compared with actual outcomes.
Analysis Published
108
Total match models
Total Accuracy
74.6%
Across all completed matches
Last Match Accuracy
78.2%
India vs England
Match Reports
31
Generated in real-time
Best Category
82.4%
Team score insights
High-Accuracy Stats
12
80%+ precision models
Next Match Spotlight
Group Stage • Match 33India
Rank #1VSToday • 7:00 PM
Australia
Rank #2Today • 7:00 PM ISTWankhede Stadium, Mumbai
Venue Head-to-Head (T20s at this venue)
| Metric | India | Australia |
|---|---|---|
| Venue Wins | 8 | 5 |
| Avg. Runs | 181 | 174 |
| Highest Score | 212 | 201 |
Key Insight: India have won 3 of their last 4 encounters at this ground with an average powerplay score of 54 runs.
Upcoming Matches
England
vsSouth Africa
12 Feb 2026 • 3:00 PM
Eden Gardens, Kolkata
Pakistan
vsNew Zealand
14 Feb 2026 • 7:00 PM
R. Premadasa Stadium, Colombo
Recent Results
India 174/3England 171/8
India won by 3 runs
10 Feb 2026
Wankhede, Mumbai
Australia 201/5Pakistan 169/8
Australia won by 32 runs
09 Feb 2026
MCG, Melbourne
New Zealand 156/7South Africa 157/5
South Africa won by 5 wkts
08 Feb 2026
Eden Gardens, Kolkata
Sri Lanka 143/9West Indies 147/6
West Indies won by 4 wkts
08 Feb 2026
R. Premadasa, Colombo
Current Standings
Complete group stage standings across all participating teams in season 2026.
= Qualification Zone
Group ATop 2 Qualify
| Team | P | W | L | NRR | Pts |
|---|---|---|---|---|---|
1India | 4 | 4 | 0 | +1.482 | 8 |
2Australia | 4 | 3 | 1 | +0.992 | 6 |
3New Zealand | 4 | 2 | 2 | +0.286 | 4 |
4Pakistan | 4 | 1 | 3 | -0.315 | 2 |
5Ireland | 4 | 0 | 4 | -1.244 | 0 |
Group BTop 2 Qualify
| Team | P | W | L | NRR | Pts |
|---|---|---|---|---|---|
1England | 4 | 4 | 0 | +1.321 | 8 |
2South Africa | 4 | 3 | 1 | +0.784 | 6 |
3West Indies | 4 | 2 | 2 | +0.112 | 4 |
4Afghanistan | 4 | 1 | 3 | -0.428 | 2 |
5Scotland | 4 | 0 | 4 | -1.036 | 0 |
Group CTop 2 Qualify
| Team | P | W | L | NRR | Pts |
|---|---|---|---|---|---|
1Sri Lanka | 4 | 3 | 1 | +0.864 | 8 |
2Bangladesh | 4 | 3 | 1 | +0.541 | 6 |
3Netherlands | 4 | 2 | 2 | +0.098 | 4 |
4NEPNepal | 4 | 1 | 3 | -0.462 | 2 |
5NAMNamibia | 4 | 0 | 4 | -0.781 | 0 |
Group DTop 2 Qualify
| Team | P | W | L | NRR | Pts |
|---|---|---|---|---|---|
1Zimbabwe | 4 | 4 | 0 | +1.105 | 8 |
2USA | 4 | 3 | 1 | +0.617 | 6 |
3UAE | 4 | 2 | 2 | +0.021 | 4 |
4CANCanada | 4 | 1 | 3 | -0.519 | 2 |
5OMAOman | 4 | 0 | 4 | -1.117 | 0 |
P = Played • W = Won • L = Lost • N = No Result • NRR = Net Run Rate • Pts = Points
Tournament Leaders
Meet the players setting the benchmark this season.
Most Runs
Virat Kohli
India
428Runs
12 MatchesBest Strike Rate
Suryakumar Yadav
India
148.3Strike Rate
12 MatchesMost Wickets
Jasprit Bumrah
India
16Wickets
12 MatchesBest Economy
Rashid Khan
Afghanistan
5.82Economy Rate
12 MatchesTop Run Scorers
Leading batsmen in season 2026
| # | Player | Inn | Runs | Avg | SR |
|---|---|---|---|---|---|
| 1 | Virat Kohli IND | 7 | 486 | 81.0 | 152.3 |
| 2 | Babar Azam PAK | 7 | 410 | 68.3 | 141.4 |
| 3 | Jos Buttler ENG | 6 | 389 | 64.8 | 169.1 |
| 4 | Suryakumar Yadav IND | 7 | 362 | 60.3 | 181.2 |
| 5 | Glenn Maxwell AUS | 6 | 341 | 56.8 | 178.3 |
Top Wicket Takers
Leading bowlers in season 2026
| # | Bowler | Ov | Wkts | Econ | Best |
|---|---|---|---|---|---|
| 1 | Jasprit Bumrah IND | 26.4 | 16 | 5.77 | 4/12 |
| 2 | Rashid Khan AFG | 28.0 | 15 | 5.82 | 4/18 |
| 3 | Adam Zampa AUS | 24.0 | 14 | 6.91 | 5/18 |
| 4 | Arshdeep Singh IND | 27.0 | 13 | 7.48 | 4/24 |
| 5 | Jofra Archer ENG | 23.4 | 12 | 7.26 | 3/16 |
What the Numbers Say
Simple insights and data trajectories from matches played in the selected season.
Innings-wise Average in Last 10 Matches
1st Innings
2nd Innings
Innings-wise Average by Venues
1st Innings
2nd Innings
Scores above 180 have won 68% of matches.
Pace bowlers have taken 61% of all tournament wickets.
Powerplay scoring has increased by 7 runs since Match 1.
Teams & Squads
Explore each participating team and its current tournament squad.
Tournament Venues
Compare conditions and scoring patterns across host grounds.
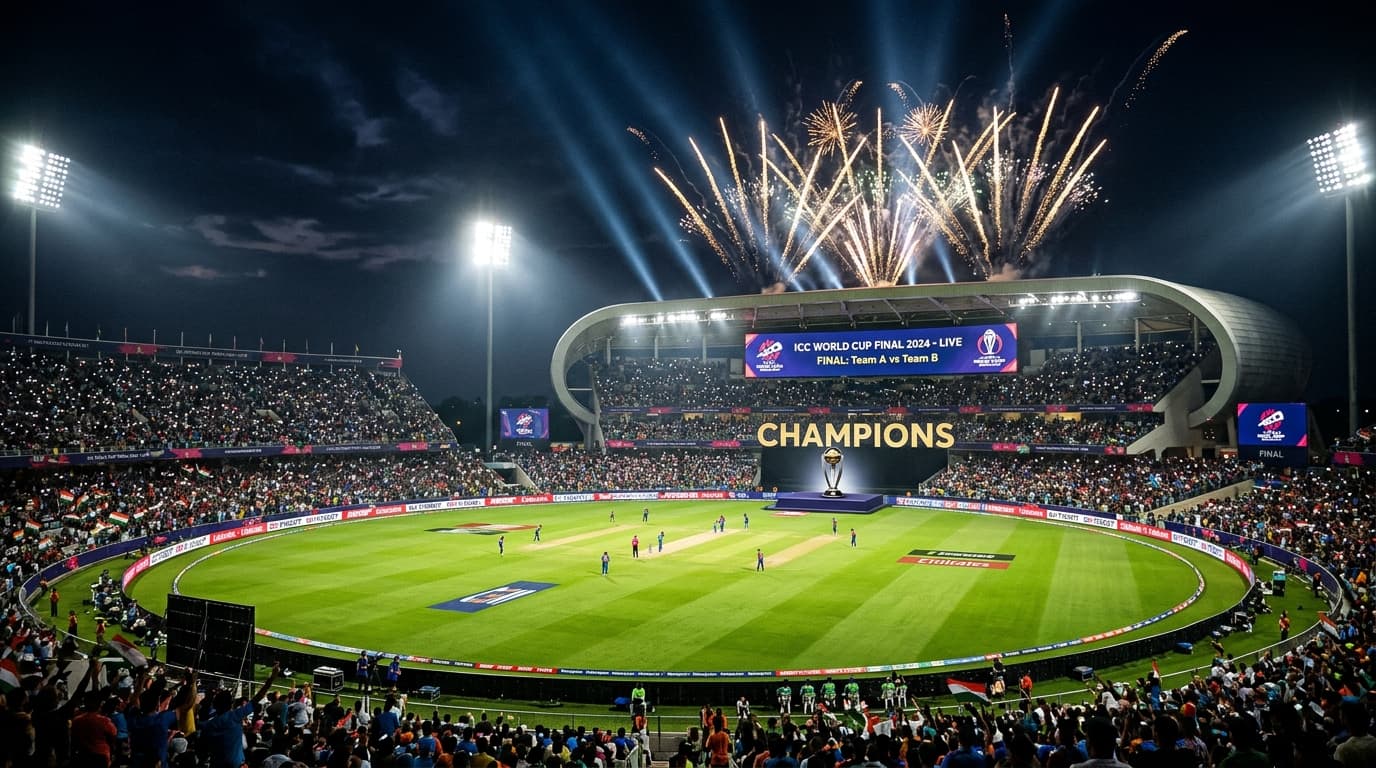
Wankhede Stadium, Mumbai
8 MatchesAvg 182 runs
Chasing Win Rate 54%Red Soil • Pace & True Bounce
Eden Gardens, Kolkata
8 MatchesAvg 176 runs
Chasing Win Rate 58%Balanced • Spin in 2nd Innings
R. Premadasa Stadium, Colombo
7 MatchesAvg 160 runs
Chasing Win Rate 55%Slow Surface • Dry Turn
Host Grounds Conditions & Scoring Distribution
Par scores, pace vs spin splits and chasing dynamics across tournament venues
| Venue | City | Matches | Avg 1st Inn | Chasing Win % | Pace / Spin Wkts | Pitch Profile |
|---|---|---|---|---|---|---|
| Wankhede Stadium | Mumbai, IND | 8 | 184 | 54% | 68% / 32% | Red soil, true carry & high bounce |
| Eden Gardens | Kolkata, IND | 8 | 171 | 58% | 55% / 45% | Balanced, grip for spin in 2nd innings |
| M. Chinnaswamy Stadium | Bengaluru, IND | 7 | 188 | 62% | 62% / 38% | Batting paradise, small boundaries |
| R. Premadasa Stadium | Colombo, SRI | 7 | 164 | 50% | 42% / 58% | Dry clay, heavy turn & low bounce |
| Arun Jaitley Stadium | Delhi, IND | 6 | 176 | 55% | 60% / 40% | True surface, short square boundaries |
Tournament Stat Insights
Compare recent and historical averages for important tournament statistics.
Match Scores
12.8(Season Avg: 14.1)
First Innings Score
168(Season Avg: 148)
Powerplay Runs
46(Season Avg: 51)
Match Wickets
14.0(Season Avg: 14.0)
Previous Seasons
Review earlier editions and compare how the tournament has evolved.
2024
Champion: India
Host: West Indies & USA2022
Champion: England
Host: Australia2021
Champion: Australia
Host: UAE & Oman2016
Champion: West Indies
Host: India